
February 29, 2024
The profession of data analysis is becoming increasingly popular, with entire schools and individual courses dedicated to teaching this field.…
The profession of data analysis is becoming increasingly popular, with entire schools and individual courses dedicated to teaching this field. Therefore, we would like to explain what a data analyst does in an advertising agency – what skills are needed for the job, what daily tasks they face, and why programming is essential for data analytics.
Who is a Data Analyst?
A data analyst is a specialist in working with data; someone who can gather information, process it, and draw conclusions from it.
Skills Required for Data Analysts
The primary skill of an analyst is, unsurprisingly, analysis. A basic understanding of statistics, the ability to identify connections where they exist, and to exclude erroneous judgments where they shouldn’t be made are crucial. These are not soft skills but rather specific skills that can be acquired and developed.
In the digital realm, data collection from various platforms and data extraction from elsewhere on the internet is common, hence the close association with programming. Basic knowledge of Python and SQL is typically required, but the list may expand depending on the specifics of the job.
What Does a Data Analyst Do at Newage. Advertising Agency?
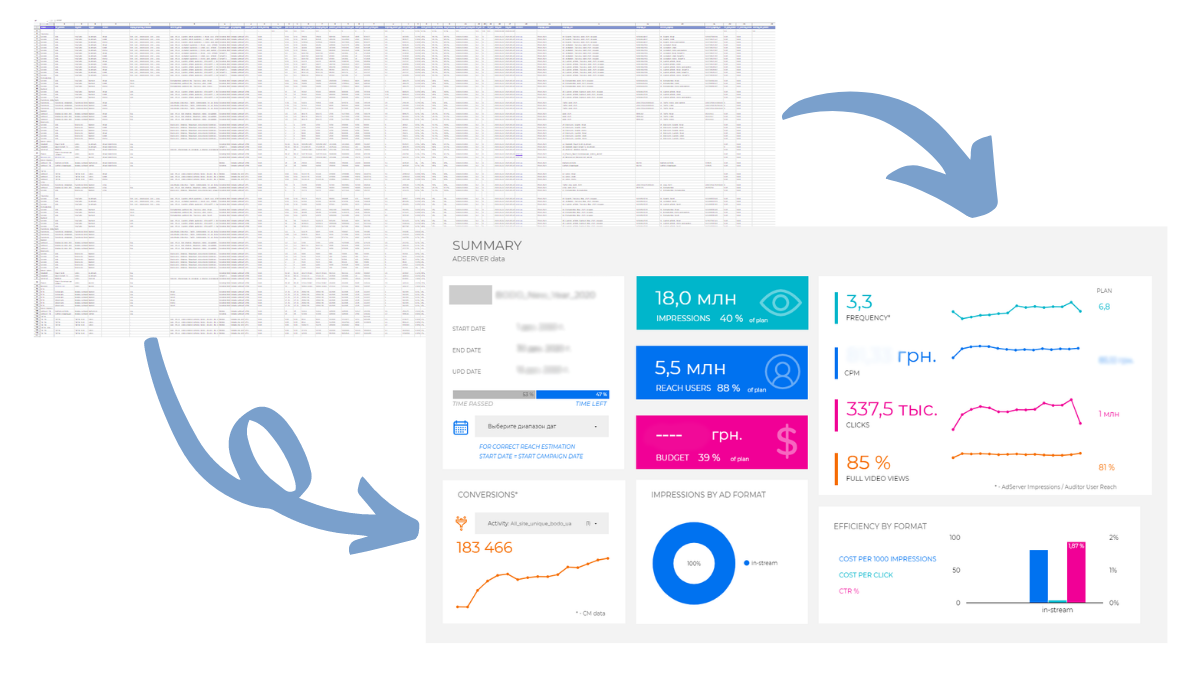
newage. advertising agency constantly deals with large volumes of data that a person is physically incapable of comprehending and processing. Therefore, we use dashboards that transform a table of hundreds of thousands of rows into a simple and understandable report. This report is called a dashboard, and in 2023, we prepared over 100 of these for our clients. It is these dashboards that occupy the daily routine of our data analysts.
Earlier we described, why do you need a dashboard for digital companies and how to work with it.
If for a client or traffic manager, a dashboard is a nice picture with big bright numbers, for a data analyst, it’s a bit more complex.

On the analyst’s side, a dashboard is a development environment.

Here on the left side, data sources are available, and on the right side, they write code to retrieve the necessary information. In this specific example, the specialist gives a command to write data from a source to our data repository in BigQuery.
“To be more precise, it’s a function that takes three parameters (dataset, dataframe, and table) and uses the write_truncate method to overwrite them in the data repository,”
Yaroslav, data analyst at newage.
In general, the concept of how a dashboard is formed is called ETL – an acronym for Extract, Transform, Load. This refers to three stages:
- Extract – obtaining data from external sources.
- Transform – transforming them into a suitable format for further work (analysis or storage).
- Load – loading them into other, final systems (especially for visualization)

Over the years of work, we have developed certain templates and ready-made solutions, and partially automated the work, but to understand the process, let’s look at each of the stages in more detail.
Step 1 — Extract
At the first stage, we extract data from various external sources:
- Google Ads:
- Campaign Manager 360:
- Meta Ads:
- Google Analytics and so on.
Preparation
To understand how to get data from a specific source, at the initial stage, you should familiarize yourself with the documentation of this tool. It’s like a huge encyclopedia on working with the source, describing how to interact with the system, what methods are available for data retrieval, what data can be obtained, and so on.
Below is an example screenshot of Google Ads documentation.

Reading documentation is crucial; without it, there’s no point in proceeding further. Because a dashboard is not an IKEA table that you can somewhat intuitively assemble without instructions; data analytics requires precision and knowledge of instructions.
Even experienced specialists regularly refer to documentation to better understand the tool and keep track of all updates.
Accessing
The next stage is to write the correct code to access the necessary tool. Here, we need to determine what we will be accessing and generate the corresponding access file to establish a connection with the tool.
Below is an example screenshot of how the connection is formed.

Data Retrieval
And now that we’ve figured out the tool, established connections with it, it’s time to write code to retrieve data. Here, the data analyst commands the tool to provide specific data from a specific source. For example, by writing the function below, we will get the campaign budget from Google Ads (both overall and per day).

Step 2 — Transform
This is an important stage where a long string of text is transformed into something understandable and structured.

Transformation
After obtaining data from different sources, it needs to be transformed in a way that makes it usable. At this stage, programming skills are joined by analytical skills. Here’s what it involves:
- Removing errors and duplicates.
- Filling in empty values.
- Adding new fields.
- Changing data types (because the type is important for the final repository).
- Aggregation and merging.
Storage
When the data becomes structured and organized, it’s time to load it into the repository. We use BigQuery for this purpose. Here, various datasets – “containers” – hold tables. For example, the container with Facebook data looks like this. Even within one campaign of one advertiser, a lot of information accumulates about audience interactions. We see separate tables dedicated to impressions, coverage, clicks, expenses, frequency, and so on.

And to obtain each of these tables, the data analyst individually collected and transformed the data because we cannot store unstructured data in the repository.
Interaction
Next, the analyst can access the data collected in the repository and process it. For example, using the code below, you can gather conversions recorded by different advertising systems and combine them.

And after this merging, the data is also written to the repository and goes to the final dashboard.
Step 3 — Load
When the data is already in perfect condition, error-free, understandable, and structured, we “feed” it for visualization to another Google service – Looker, and as a result, we get a bright interactive document with all the important indicators.

Step 4 — Bug Hunting
This is an integral part of the job, no matter how careful and attentive the specialist is. A significant part of the day for data analysts (like other programmers) is spent reviewing their own code to understand where something went wrong, why some data is missing.
There is a lot of code, and it all needs to be maintained and improved, so be prepared for bug hunting and understanding that not everything always works perfectly.
Conclusion
- The profession of data analytics is indeed popular; the more the world digitizes, the more people are needed who can understand and explain these numbers.
- To work as a data analyst, a range of hard skills is required, including programming skills in Python (the more languages, the better) and analytical skills.
- At newage., analysts mostly work with dashboards for client reporting, following the ETL (Extract, Transform, Load) algorithm.
- Another component in the work of a data analyst, like any programmer, is bug hunting to improve the code; which is a significant challenge when dealing with thousands of lines.


Get deeper into digital!
Subscribe to the newage. digital digest and receive exclusive bonus content


